Services
Powerfull Excel Report
A powerful Excel report designed to turn raw data into clear, actionable insights. With automated formulas, dynamic charts, and smart dashboards, this report helps you track performance, identify trends, and make data-driven decisions with confidence. Built for accuracy, speed, and professional presentation — everything you need in one clean, easy-to-use file.
✅ Excel Work Basic to Expert
- Data entry aur data cleaning
- Sorting & filtering
- VLOOKUP, HLOOKUP, XLOOKUP Etc.
- Pivot Table & Pivot Charts
- Conditional Formatting
- Data Validation (Drop-down, restrictions)
- IF, AND, OR, SUMIF, COUNTIF formulas
- Advanced formulas (INDEX-MATCH, TEXT formulas)
- Data Modeling
- Dashboard creation
- Charts & graphs (Line, Bar, Pie, KPI)
- Power Query Data Automation and Report Automation
- Power Query se data cleaning automation
- Power Pivot se data modeling
- Multiple file combine & merge data
- Duplicate remove & data formatting
- Financial calculations (ROI, EMI, Profit/Loss)
- Sales report, expense report, inventory report
- Sales report, expense report, inventory report
- Macros/VBA automation
- What-If Analysis, Goal Seek
- Time tracking & attendance sheets
- nvoice & billing template creation
- Custom Report
- Custome Template Creation

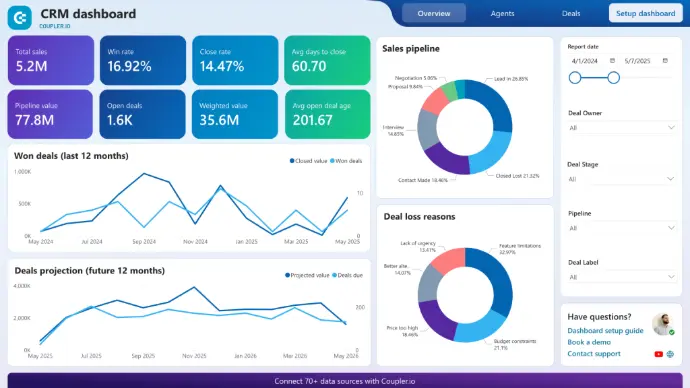
Power BI Dashboard and Insigts
A Power BI dashboard that delivers clear, interactive, and real-time insights. It converts raw data into meaningful visuals, tracks KPIs automatically, and helps identify trends instantly. Designed for accuracy and speed, it empowers smarter decision-making and gives leaders a complete view of business performance in one powerful dashboard.
✅ Power BI Basic to Expert
- Import data from multiple sources
- Clean and transform data using Power Query
- Build data models with relationships
- Write DAX formulas (CALCULATE, SUMX, FILTER, etc.)
- Create interactive dashboards
- Add KPIs, cards, slicers, and filters
- Build drill-down and drill-through reports
- Use custom visuals for advanced insights
- Set up Row-Level Security (RLS)
- Create real-time dashboards
- Publish reports to Power BI Service
- Schedule automated data refresh
- Embed reports into Teams, websites, and mobile
- Use bookmarks for storytelling and navigation
- Merge and join multiple datasets
- Perform forecasting and trend analysis
- Design buttons and navigation pages
- Create page tooltips for detailed insights
- Optimize performance and improve DAX efficiency
- Automate reporting and share dashboards easily

MySQL Complex Query
MySQL is a fast and reliable database system that stores, manages, and organizes data efficiently. It supports powerful queries, secure operations, and scalable performance for business applications and analytics.
✅ SQL Basic to Expert
- Write basic queries using SELECT,
- WHERE, ORDER BY
- Filter data with conditions and operators
- Group and summarize data using GROUP BY & HAVING
- Use aggregate functions (SUM, AVG, COUNT, MAX, MIN)
- Create and manage tables, views, and schemas
- Create, read, update, and delete data (CRUD operations)
- Use JOINs to combine multiple tables
- Insert large datasets efficiently
- Build complex queries using subqueries
- Create indexes for faster performance
- Write stored procedures and functions
- Manage users and permissions
- Perform database backup and restore
- Optimize query performance
- Create relationships with primary & foreign keys
- Handle NULL values and data constraints
- Import/export data from other sources
- Build dynamic reports using SQL queries
- Design relational database structures
- Ensure database security and stability
Driving Success Through Innovation
Empowering Businesses to Reach New Heights
01 Data Cleaning
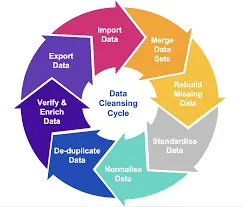
Customized solutions for your business needs
02 Table Reports

Expert advice to navigate complex challenges
03 BI Dashboard
Proven strategies for sustainable growth
04 Final Consulting

Partner with us to unlock your potential
Innovation
How ideas come to life
Focus
Building connections

22%
Reaching new Customers
+12
Client Satisfaction in this Week
Trands
"Our partnership with DATA REVOLUTION CONSULTING GROUP Consulting has transformed our operations and exceeded our expectations." - Happy Client

"Our partnership with "DATA REVOLUTION CONSULTING GROUP" Consulting has transformed our operations and exceeded our expectations." - Happy Client

"Our partnership with DATA REVOLUTION CONSULTING GROUP Consulting has transformed our operations and exceeded our expectations." - Happy Client

Client Testimonials and Case Studies
Leverage this section to enhance your firm's reputation.